
Mariton: Historical Precipitation Thoughts
by Tim Burris, Preserve Manager
I was watching the weather forecast recently and the meteorologist showed the month’s calendar with the days colored red for above average temperatures, and blue for below average. I would really have loved to see the same calendar side by side with one from 1921. It would be difficult, but very interesting to see the 1921 calendar based on the average at that time. Consider that the average temperature for each day in 1921 would be different than today (because there is 100 years of data added into the mix). Some days may be very similar, but like the calendar the meteorologist displayed the temperatures varied from average on most days of the month. And there were only a few days colored gray denoting that they were right on average. Even with lots of data points to flatten the swings, those fluctuations affect the average bit by bit. Since we have witnessed a general warming trend in the last few decades it would be interesting to compare today’s average with 1921’s average temperatures.
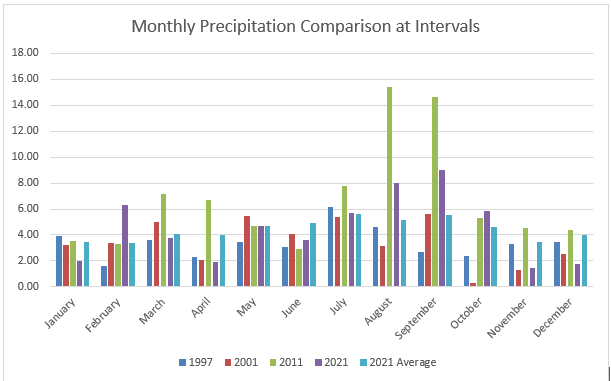
I don’t have 100 years of precipitation data, but I realized that I could make something like I wanted to see for a time perspective. I selected four years from the last twenty-five years to show the monthly precipitation for each month. There is also a column to show the average in 2021. Notice the differences (or similarities) between the actual precipitation amounts from 2021 (purple) and the 2021 Average (light blue) in the chart below.
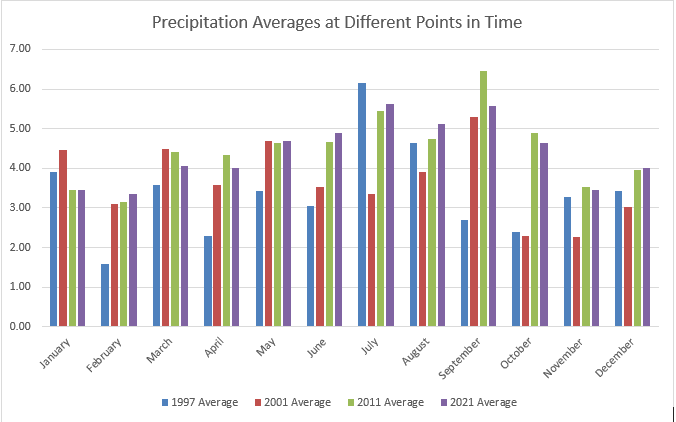
I wanted to show how the average can change over time. So, I made a chart that showed the average precipitation by month based on data received up to 1997, 2001, 2011, and 2021. In the chart below there is ten years of data between 2001 bar (red) and the 2011 bar (green) for each month. That extra data changes the average with each decade, sometimes drastically.
Just to add some perspective… I looked at the average total precipitation for the entire year. So, in 2001 there is 5 years worth of data, and in 2021 there is twenty-five years worth of data that were averaged for the numbers below.
1997: 40.39″
2001: 43.97″
2011: 53.69″
2021: 52.98″