
Mariton: 2020 Precipitation Retrospective
by Tim Burris, Preserve Manager
As 2021 begins, I want to look back at 2020’s precipitation records. The precipitation recorded for November and December at Mariton Wildlife Sanctuary was above average, still the year ended almost three inches below average for the entire year. I recorded 50.03 inches for 2020. The average is 52.94 inches.
I recorded 5.47” of precipitation for December (December’s average is 4.11”). Most of that fell as liquid precipitation, or rain. When we get snow or sleet, I melt that and measure the liquid. For instance, if all of December’s precipitation had fallen as snow we would have received about 55” (four feet – seven inches) of snow. The Nor’easter snowfall of December 16 & 17 yielded about 8” of snow and sleet. Melted, it measured 1.18” of liquid water. That could have yielded roughly 12 inches of snow if it had stayed cold, and not turned to sleet.
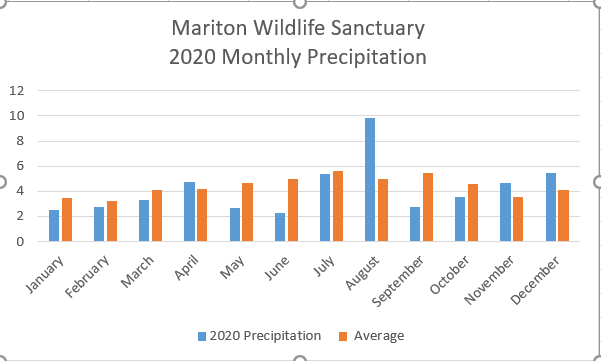
First, let’s look at 2020’s monthly precipitation compared to the average for that month. You can see from the chart below that several months were below average. It is amazing that we never really felt like we were going through drought. That is because we received precipitation when we needed it, even if it was below average.
Below is 24 years of annual precipitation data from Mariton. I’ve been at Mariton for almost 29 years and kept precipitation data from the beginning. Unfortunately, in 1996 we had a lightning storm that fried the computer where I stored all my data.
It still bugs me that we weren’t able to retrieve those years. Partly because in the early 1990’s, when I started, we went through a long dry period. Annual precipitation was in the low 40 inch zone for several years. You can see the end of that decade long dry spell at the very beginning of the chart.
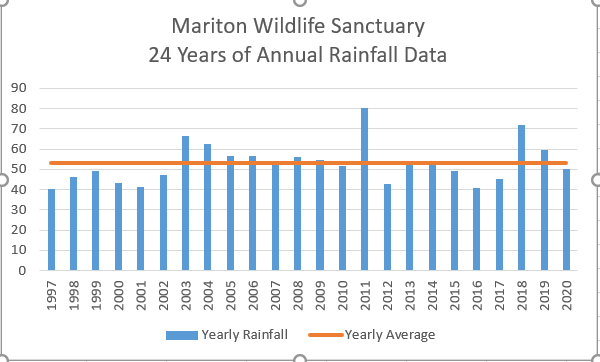
2020 had below average precipitation, but many long range models show us getting wetter as our climate changes. Since I have only a quarter century of data, that trend is more difficult to discern from the chart. Because I’ve been recording it daily all these years, and am able to look at side by side comparisons in my spreadsheets, I can see things are getting wetter.