Crow’s Nest: And now for something completely different
By Daniel Barringer, Preserve Manager.
It’s been a long time for me since college physics where we did a little playing around with circuit boards, LED’s and processors, and just maybe the technology has changed a bit since then. So I was very excited to play with the Mayfly data logger as we were getting trained on how to use the hardware and software to collect water quality data from streams on Natural Lands preserves.
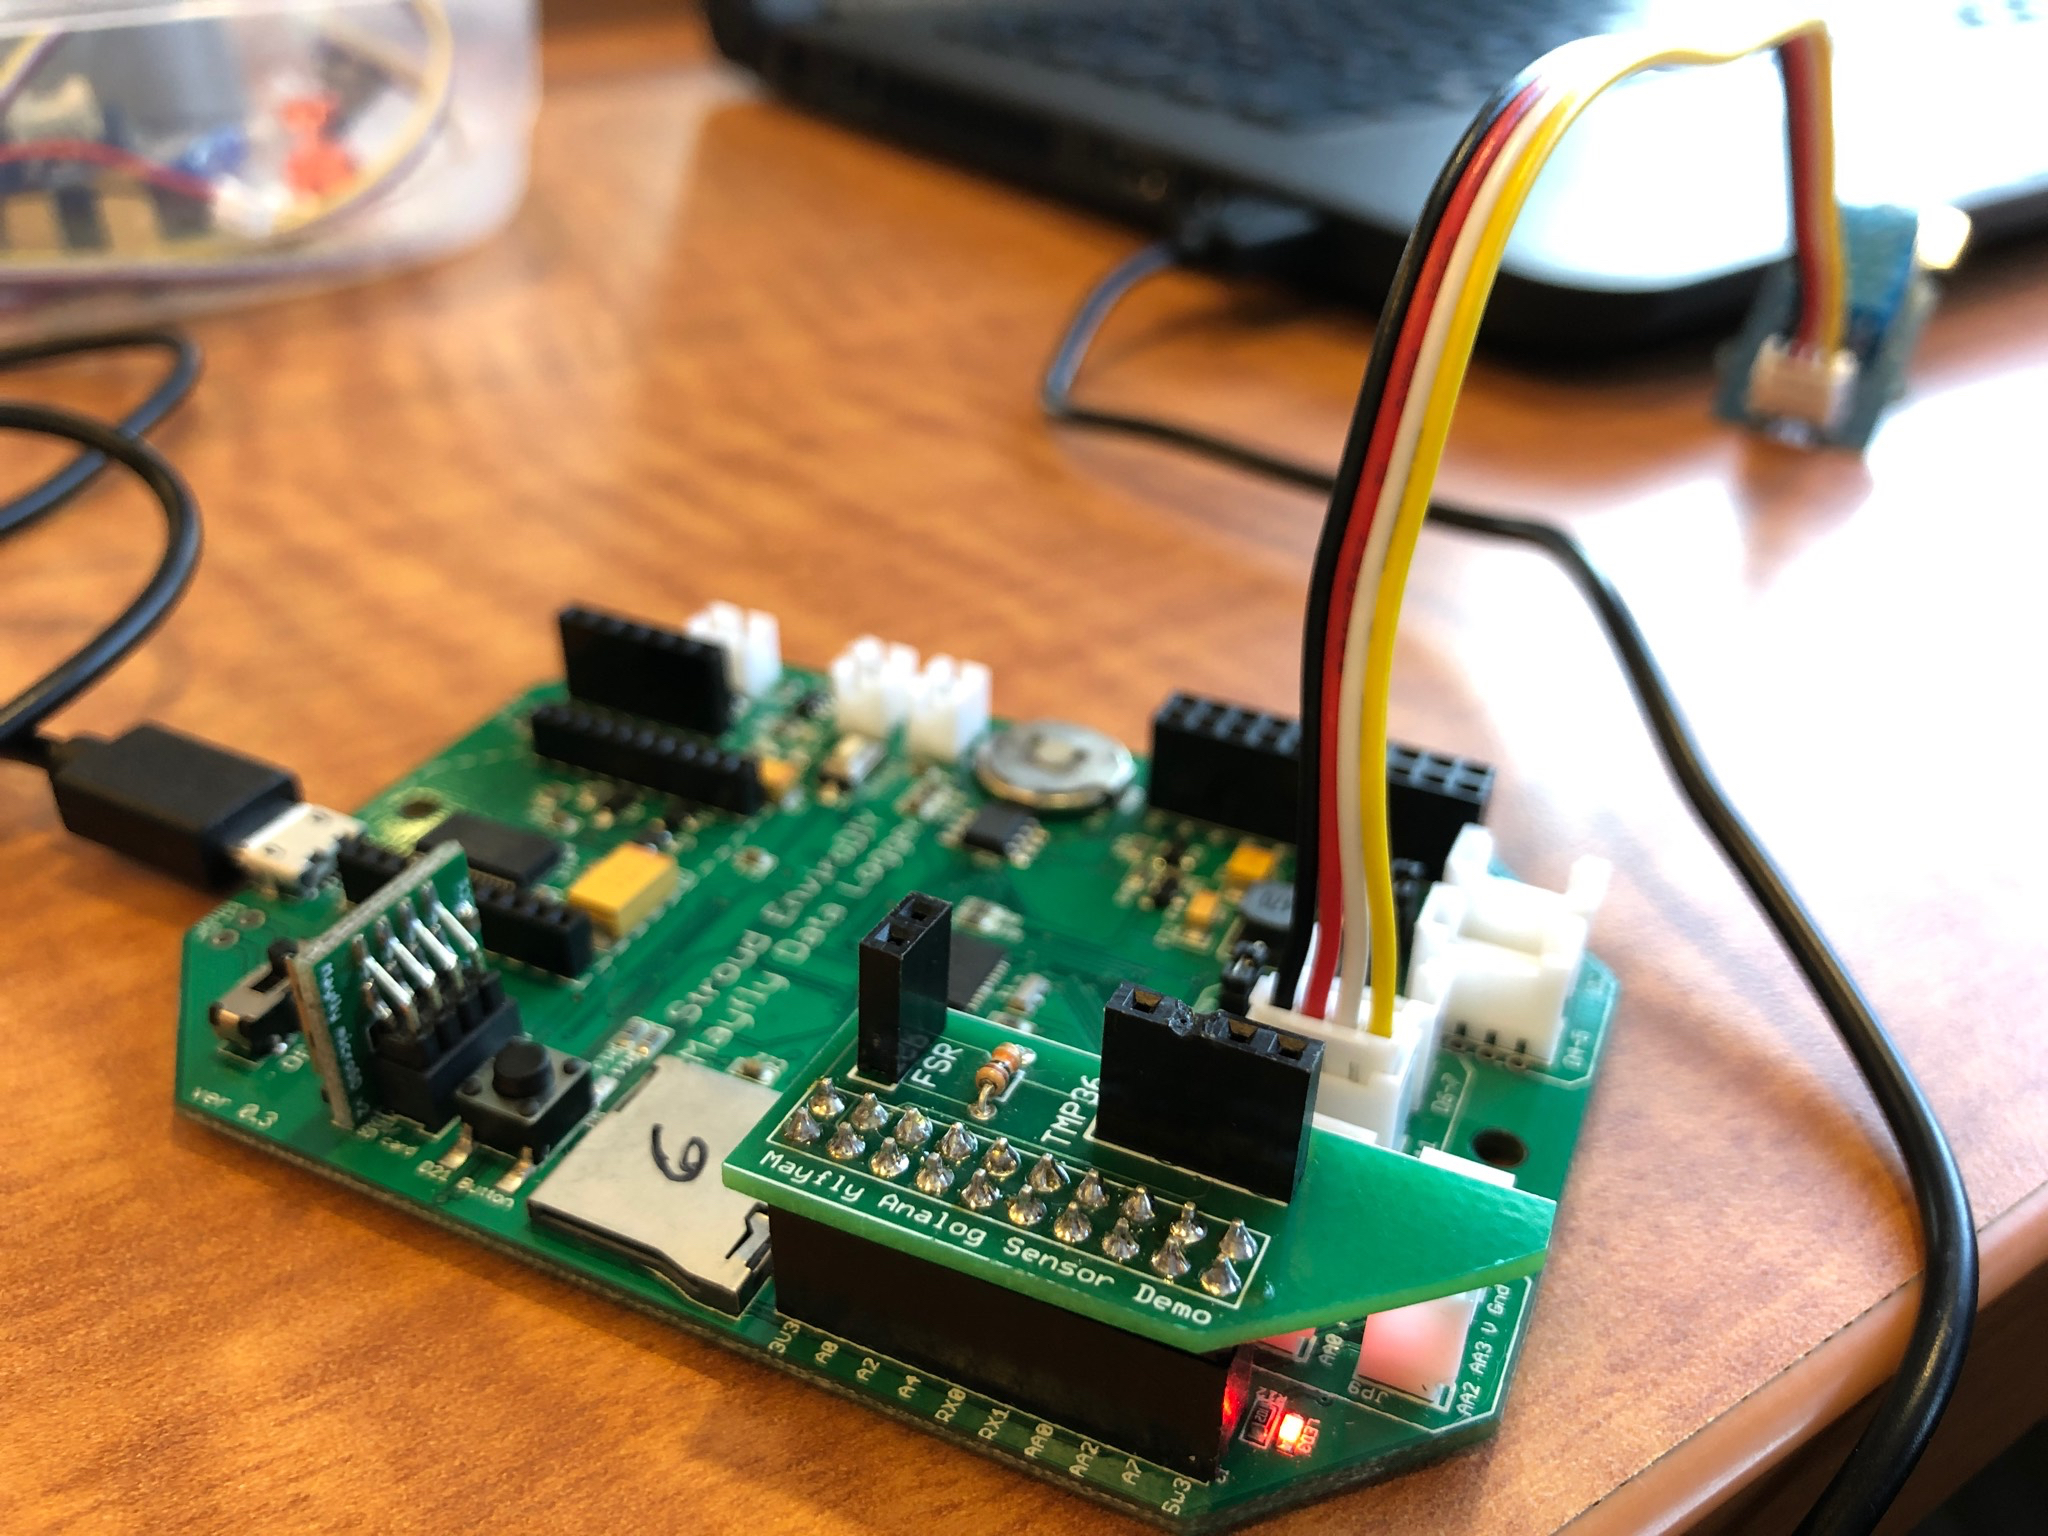
The Mayfly, designed by Shannon Hicks for the Stroud Water Research Center, is a low cost DIY alternative to expensive or more limited data-collection devices. It is based on the software programming and community used with Arduino devices but uses a more powerful processor and has more features needed for this kind of data collection. It remains open-source hardware and software where users share their modifications with the community. Attached to sensors deployed in a stream a number of data types can be collected in real time: temperature, stream depth, turbidity, and conductivity.
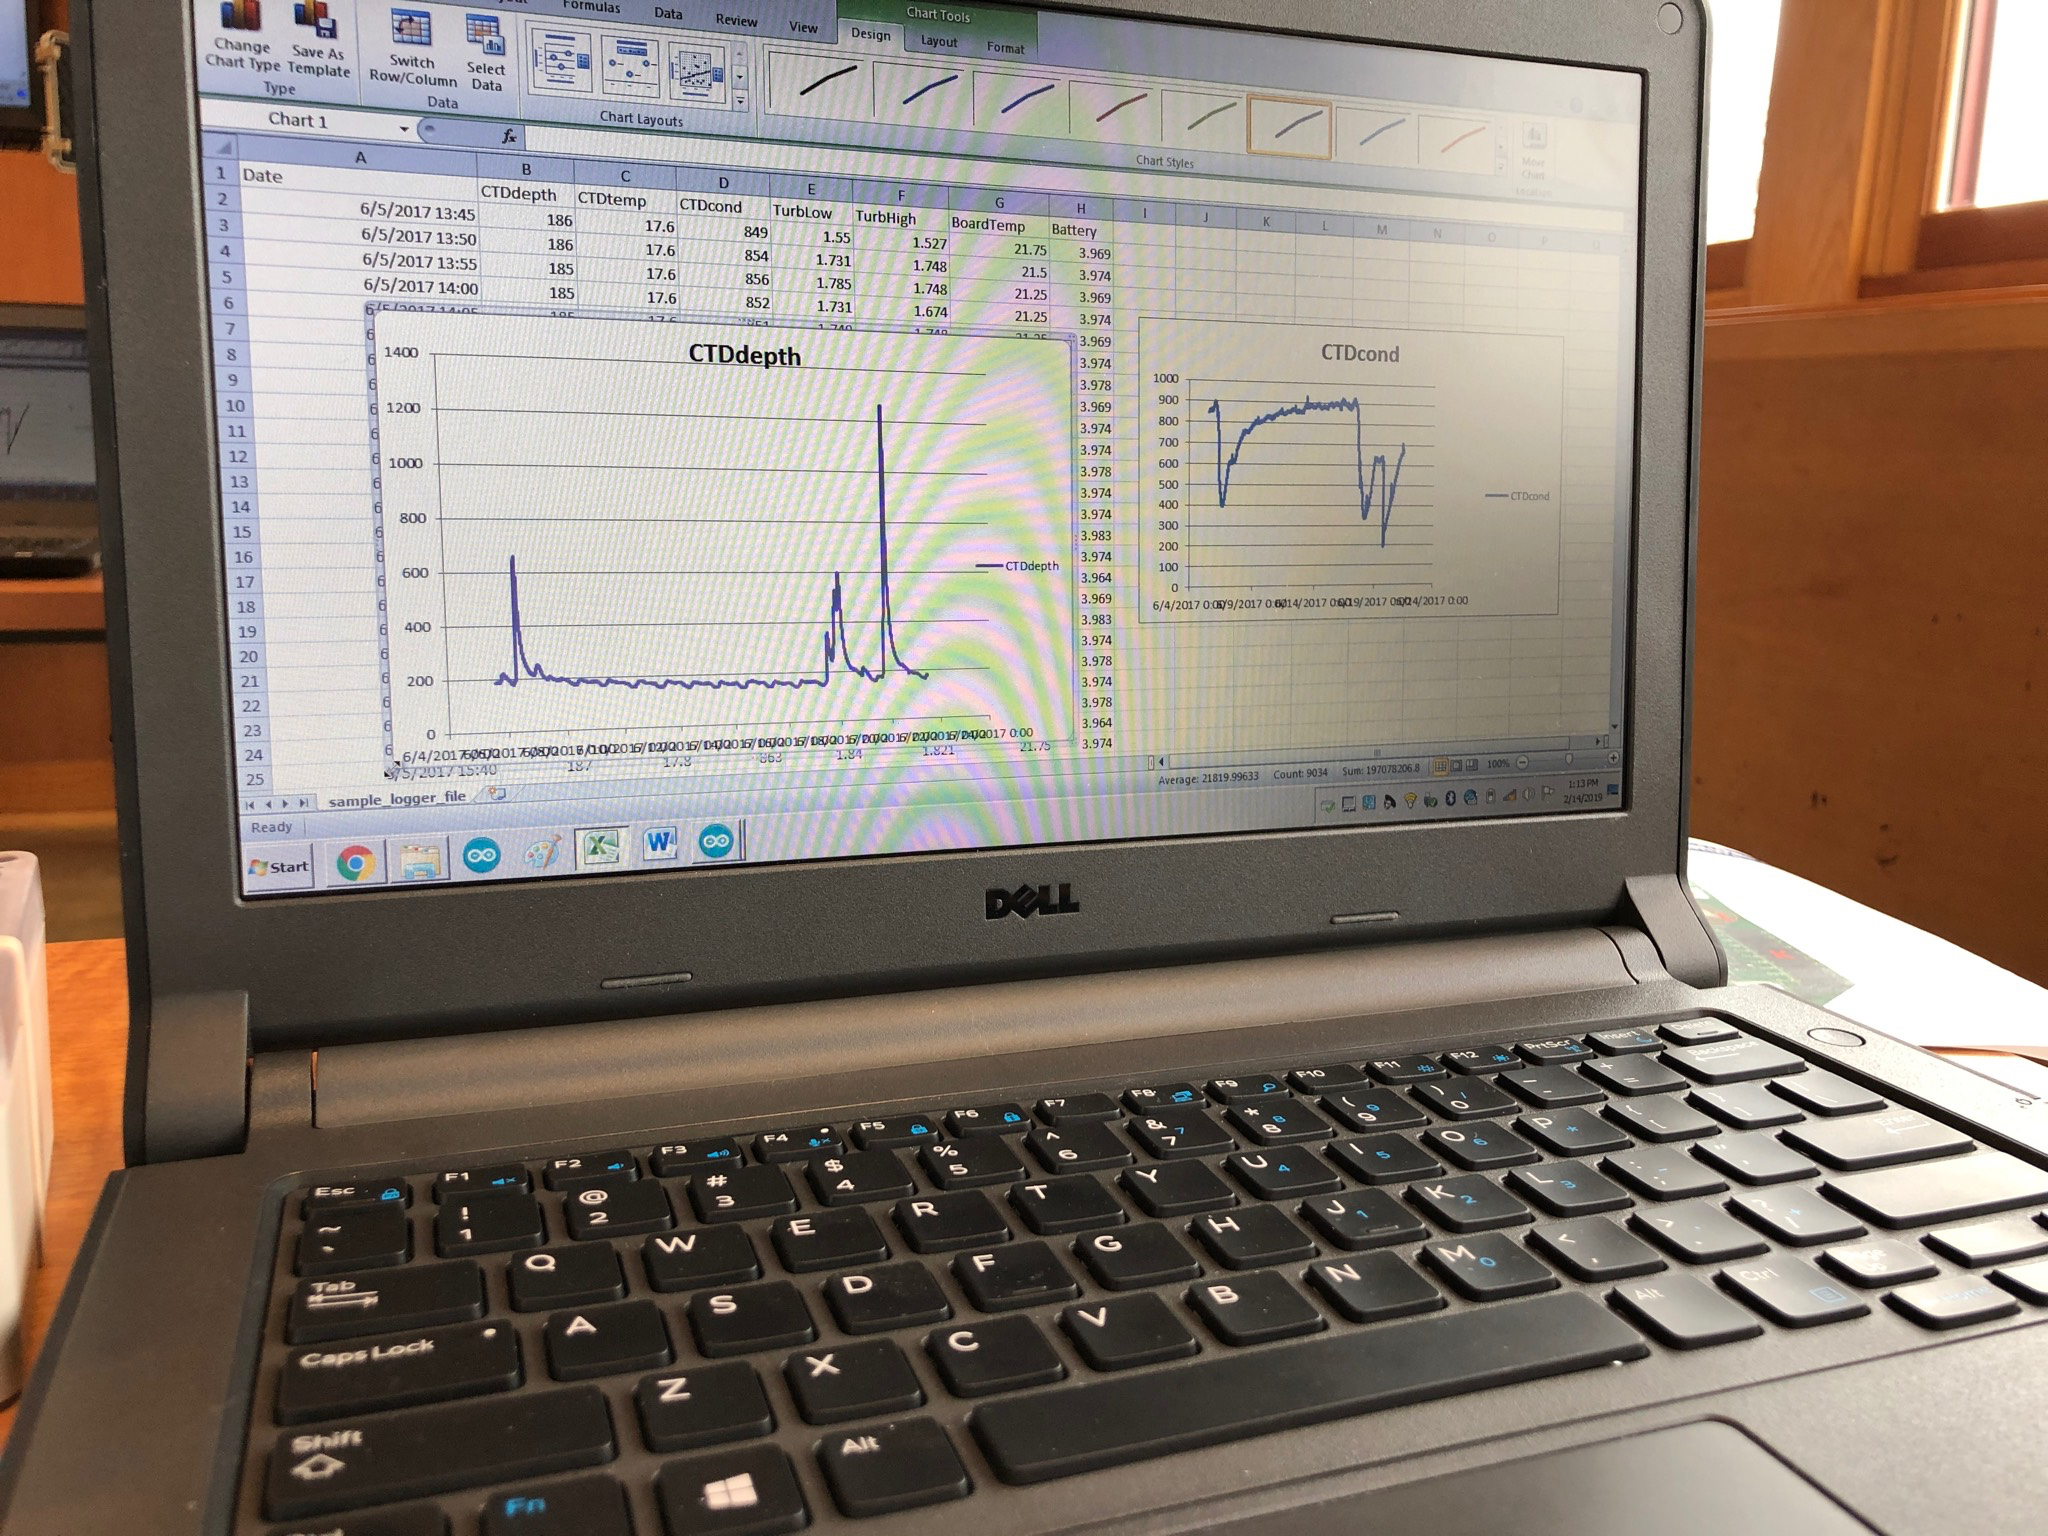
Below is some of the data collected and imported into Excel and then graphed: you might notice that about the time the stream depth rises dramatically (due to rainfall) the conductivity drops (the minerals which enhance conductivity, such as road salt, are diluted by the rain). And we learned that the stream depth varies daily during the growing season, even if there is no rainfall, since during the day evapotranspiration of trees lowers stream levels which then rise slightly every night.
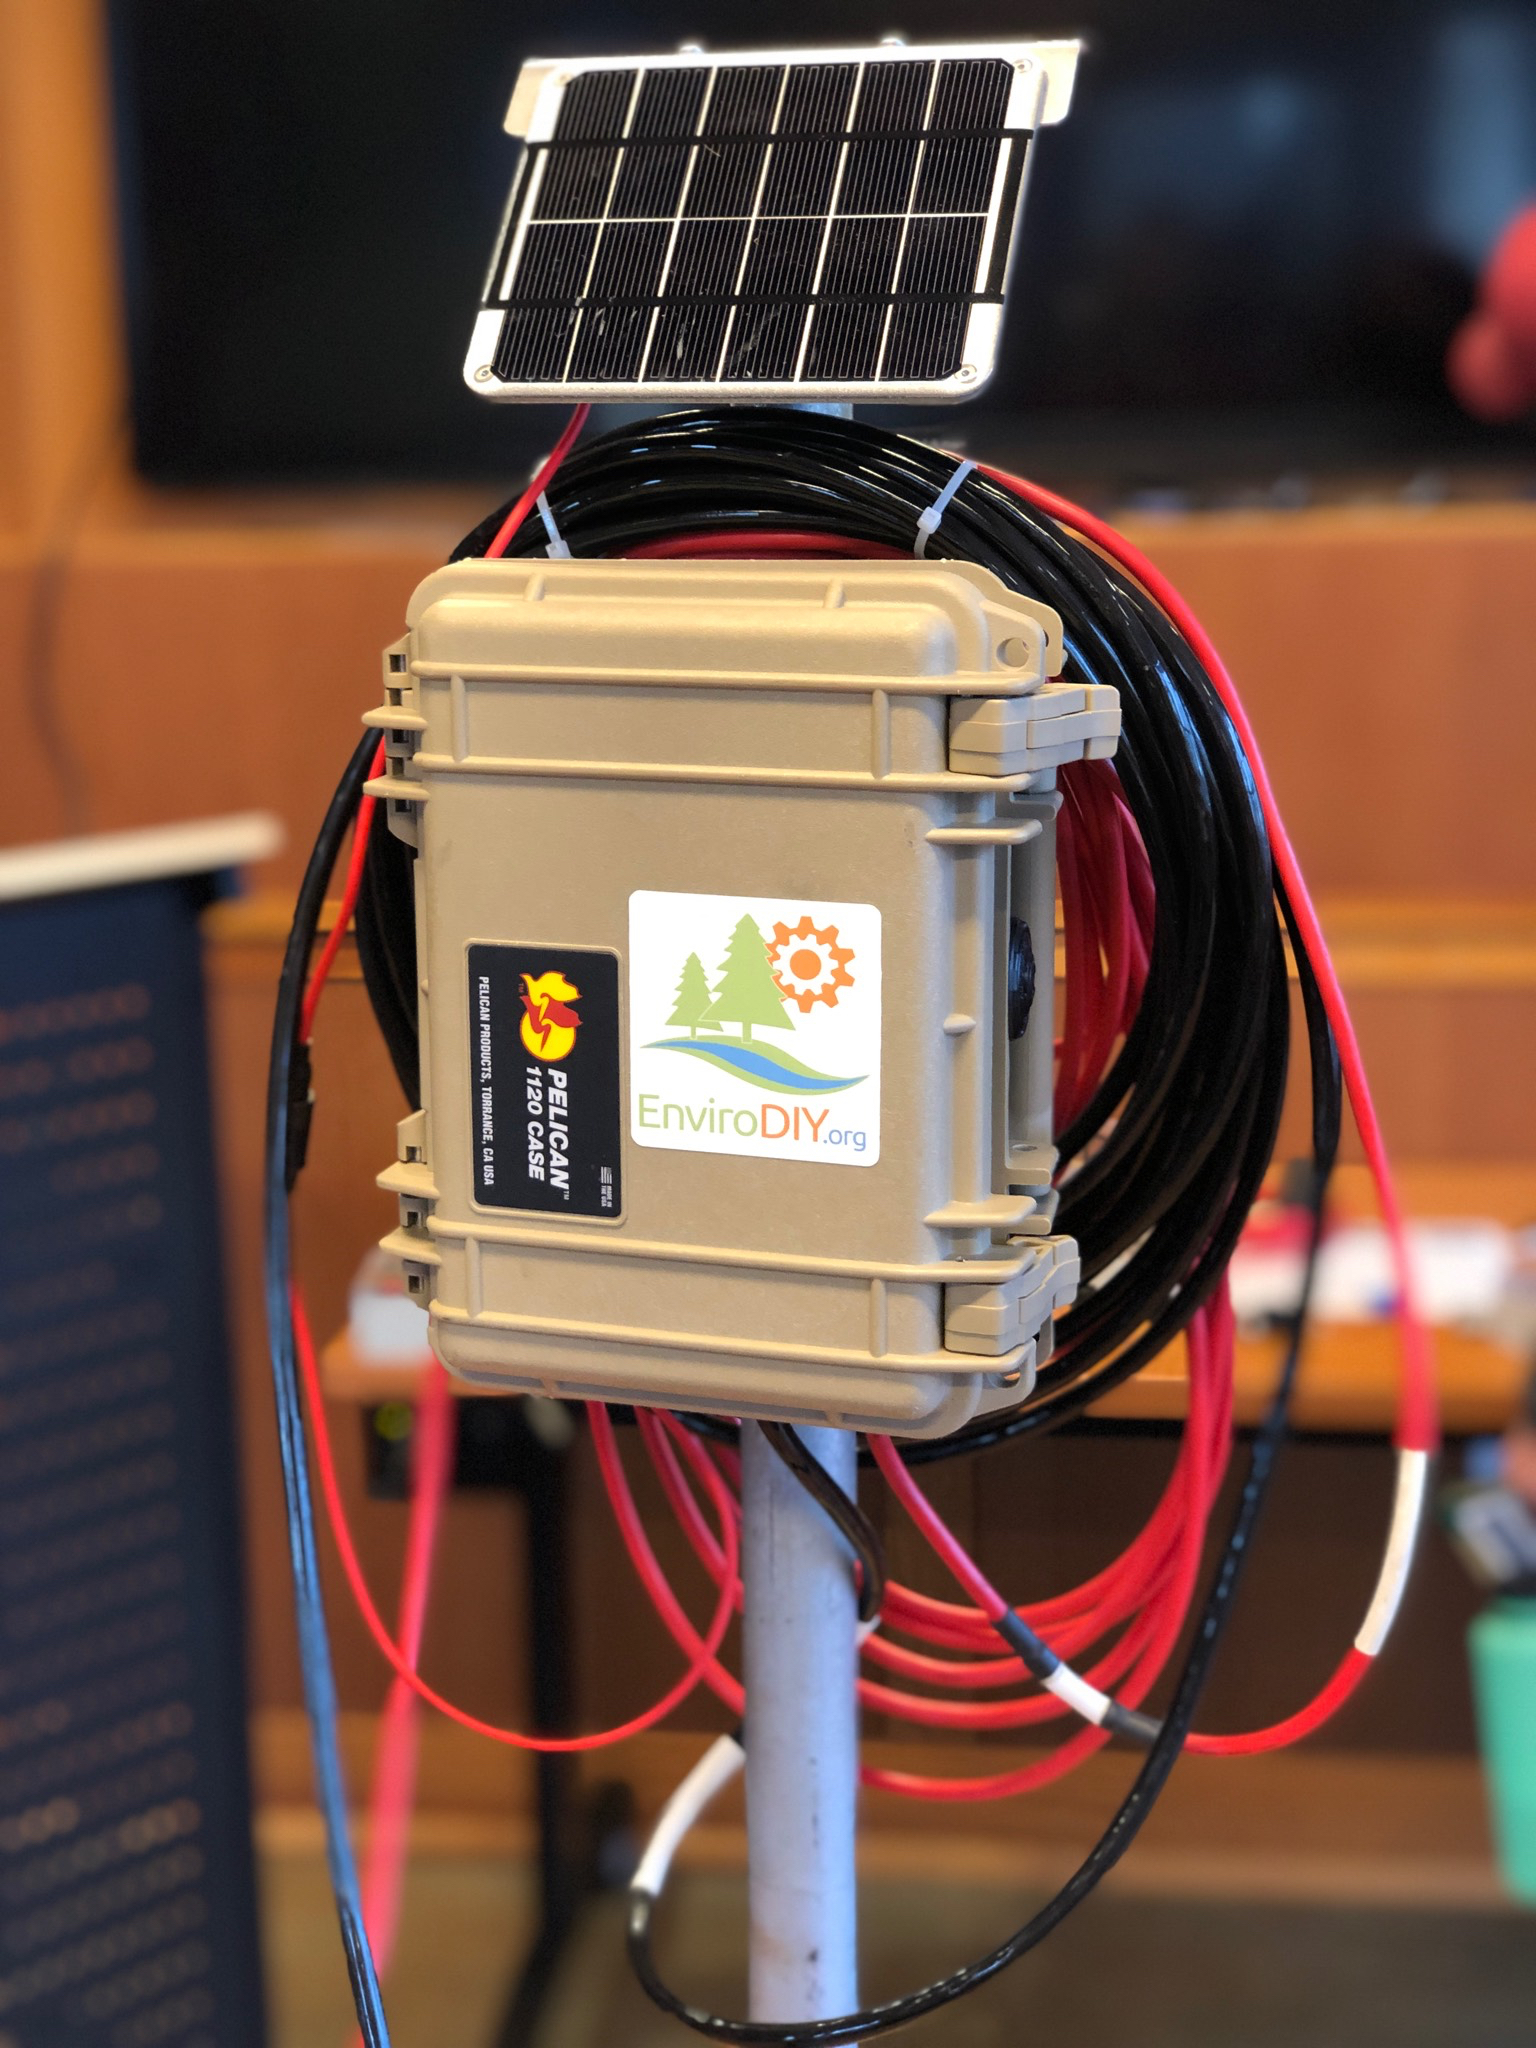
Natural Lands will be deploying a couple of these monitors (pictured below) on a preserve to study the effects of construction nearby (i.e. comparing data collected upstream and downstream of the disturbance). Later, they will be used at various preserves to collect baseline data or conduct specific research.
The data is stored on an SD card on the Mayfly board but also can be transmitted to a computer and uploaded to a website to show local stream data in real time. You can see data from various sites around the country here. Then you can compare the data with weather data or other occurrences you know are going on in the watershed. The folks at Stroud refer to the technology as the equivalent of Weather Underground for streams.
The simplicity and elegance of the technology impressed me. It doesn’t look simple at first glance but our instructors broke the process down and demystified it for us, letting us play with the hardware, programming and data. It isn’t a chainsaw or a brush hog (things that are also useful to have demystified) but every bit as useful. I also appreciated that, having done a couple hundred deployments of this technology, Stroud has worked out the easiest way to address every step from waterproofing the device to pounding the post that holds it into the ground.